Notes
Sort by:| Metadata | Start Date | End Date | Comment |
|---|---|---|---|
|
GA01SUMO-RII11-02-CTDBPP031 Deployment: 2 |
1/31/16, 12:00 AM | 2/4/16, 12:00 AM |
Conductivity, salinity and density dropped suddenly, then returned to reasonable values. This appears to be a real event as it was captured by other CTDs on this mooring (GA01SUMO-RII11-02-CTDMOQ015, GA01SUMO-RII11-02-CTDBPP032, and GA01SUMO-RII11-02-CTDBPP033) By Lori Garzio, on 2/7/19 |
|
GA01SUMO-RII11-02-CTDMOQ015 Deployment: 2 |
1/30/16, 12:00 AM | 2/1/16, 12:00 AM |
Salinity and density dropped suddenly, then returned to reasonable values. UPDATE: This appears to be a real event as it was captured by other CTDs on this mooring (GA01SUMO-RII11-02-CTDBPP031, 32, and 33) By Lori Garzio, on 1/31/19 |
|
GA01SUMO-RII11-02-CTDBPP031 Deployment: 2 |
The 6 day data gap at the beginning of the deployment should be annotated. If more details are known, annotation ID 126 should be updated to include why the instrument failed. By Lori Garzio, on 2/7/19 |
||
|
GA01SUMO-RII11-02-CTDBPP032 |
If more details are known, annotation IDs 127 and 430 should be updated to include why the instruments failed during deployments 2 and 3. By Lori Garzio, on 2/7/19 |
||
|
GA01SUMO-RII11-02-CTDBPP033 |
If more details are known, annotation IDs 416 and 417 should be updated to include why the instruments failed during deployments 2 and 3. By Lori Garzio, on 2/7/19 |
||
|
GA01SUMO-RID16-03-CTDBPF000 Deployment: 2 |
11/14/15, 9:06 PM | 11/8/16, 10:10 AM |
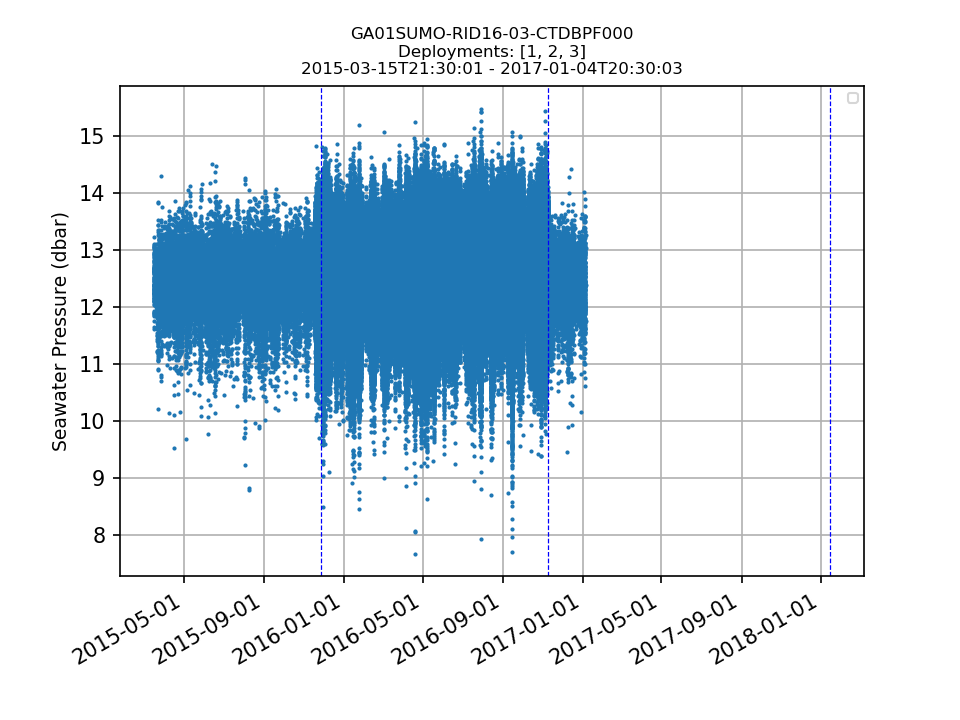
The sampling rates for deployments 1 and 3 are 900 seconds (15 mins), but the sampling rate for deployment 2 is 12 seconds. This deployment should be annotated to explain why there is a difference in sampling rates. It appears that the high sampling rate captured a greater range in seawater pressure (see attached figure). By Lori Garzio, on 2/7/19 |
|
CP03ISSM-MFD35-06-PHSEND000 Deployment: 3 |
Need an annotation for a 30 days gap at the end of deployment. By Leila Belabbassi, on 2/6/19 |
||
|
CP03ISSM-MFD35-06-PHSEND000 Deployment: 3 |
Add an annotation for missing data from telemetered and recovered_host. By Leila Belabbassi, on 2/6/19 |
||
|
CP03ISSM-MFD35-06-PHSEND000 |
pressure coordinate is missing from the netCDF files. By Leila Belabbassi, on 2/6/19 |
||
|
GS01SUMO-RII11-02-CTDMOR020 Deployment: 1 |
2/18/15, 9:06 PM | 12/27/15, 11:20 AM |
Annotation ID 749: "High conductivity bias starting in the middle of the deployment (around July 2015)." This should be investigated and the annotation should be updated. Excluding entire deployment from final statistics. By Lori Garzio, on 2/5/19 |
|
GS01SUMO-RII11-02-CTDMOQ015 Deployment: 2 |
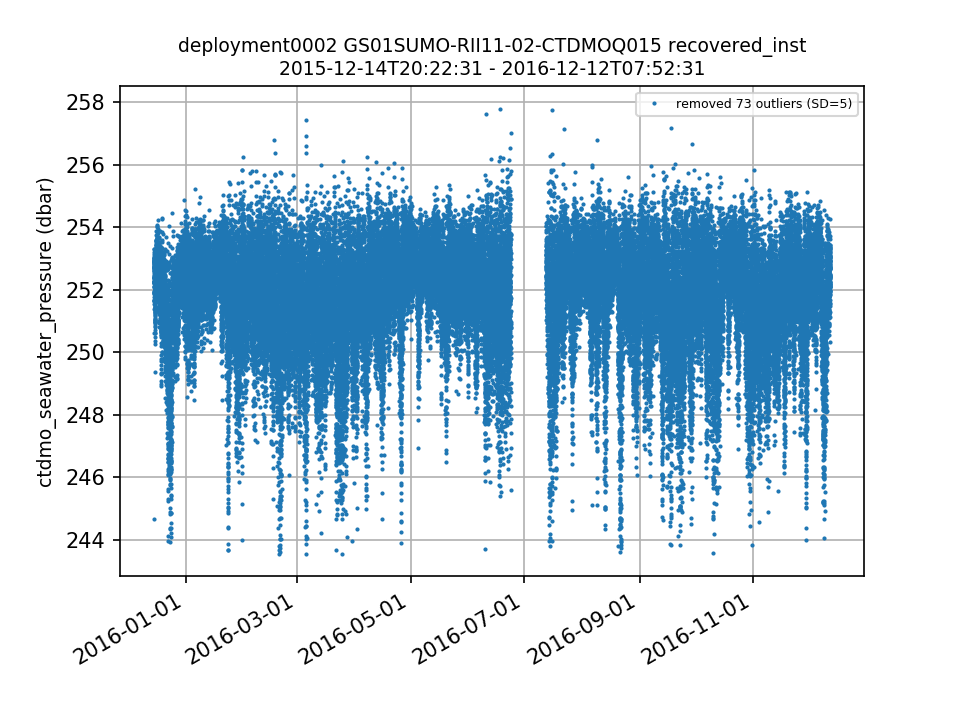
6/23/16, 4:30 PM | 7/12/16, 3:45 PM | |
|
GS01SUMO-RII11-02-CTDMOQ014 Deployment: 2 |
11/8/16, 12:00 AM | 12/12/16, 7:58 AM |
Conductivity, density and salinity drop off at the end of the deployment. This should be investigated and annotated in uFrame. Excluding from final statistics. By Lori Garzio, on 2/5/19 |
|
GS01SUMO-RII11-02-CTDMOQ011 Deployment: 2 |
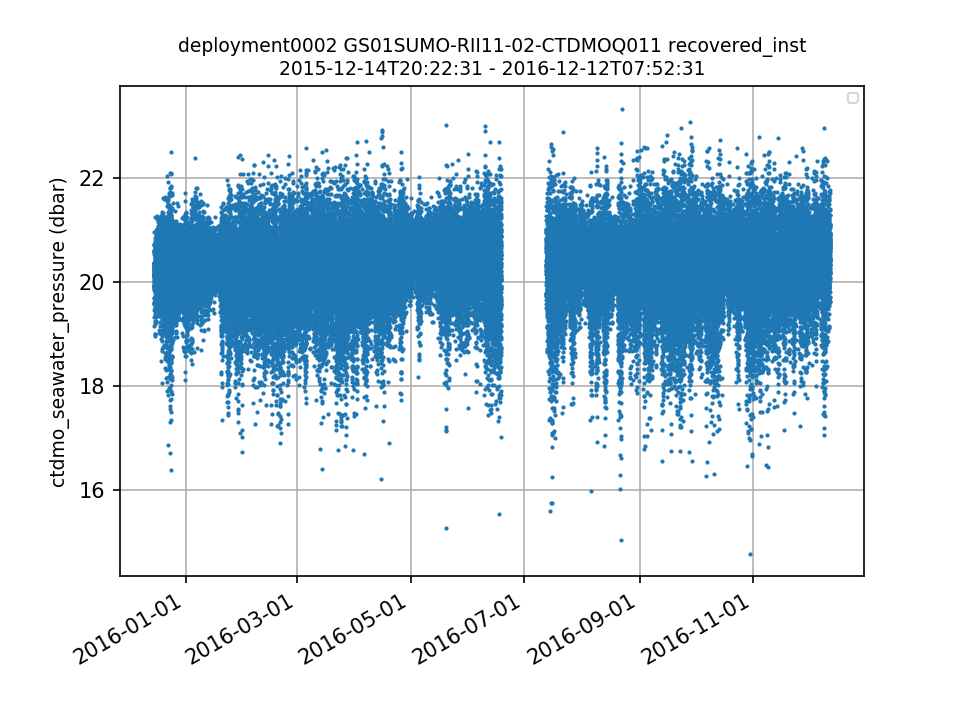
6/18/16, 2:00 PM | 7/12/16, 3:45 PM | |
|
GI01SUMO-RII11-02-CTDMOQ031 Deployment: 1 |
12/19/14, 12:00 PM | 12/20/14, 6:00 AM |
Conductivity (and salinity and density) dropped suddenly, then returned to reasonable values. Excluding data from final statistics. By Lori Garzio, on 2/5/19 |
|
GI01SUMO-RII11-02-CTDMOQ031 Deployment: 1 |
11/20/14, 12:00 AM | 11/20/14, 12:00 PM |
Conductivity (and salinity and density) dropped suddenly, then returned to reasonable values. Excluding data from final statistics. By Lori Garzio, on 2/5/19 |
|
GI01SUMO-RII11-02-CTDMOQ016 Deployment: 2 |
8/15/15, 7:22 PM | 7/19/16, 12:00 AM |
Salinity and density steadily increased throughout the deployment. This should be investigated and annotated to alert users of issues. Excluding from final statistics. By Lori Garzio, on 2/5/19 |
|
GI01SUMO-RII11-02-CTDMOQ014 Deployment: 2 |
8/15/15, 7:22 PM | 7/19/16, 12:00 AM |
Salinity and density increase gradually throughout the deployment, then drop back to values similar to the beginning of the deployment. This behavior isn't seen in surrounding CTDs and should be investigated and annotated if an issue is found. Excluding from final statistics. By Lori Garzio, on 2/4/19 |
|
GI01SUMO-RII11-02-CTDMOQ013 Deployment: 3 |
7/10/16, 5:44 PM | 8/14/17, 9:33 AM |
Temperature, salinity, and density are offset between the recovered_host/telemetered and recovered_inst datasets. Excluding data from this deployment for statistics as it's unclear which dataset is correct. This should be investigated and the incorrect dataset should be fixed or annotated to indicate which dataset is correct. By Lori Garzio, on 2/4/19 |
|
GA03FLMA-RIM01-02-CTDMOG044 Deployment: 1 |
7/15/15, 12:00 AM | 11/22/15, 12:08 PM |
Salinity and density decrease during the second half of the deployment, exhibiting a pattern not observed in any of the 4 CTDMOs surrounding this instrument (2 shallower and 2 deeper). CTDMOG044 is colored green in the composite plots attached. This could be a real event, but should be investigated and the data should be annotated. Excluding data from final statistics. By Lori Garzio, on 1/11/19 |
|
GA01SUMO-RII11-02-CTDMOQ031 Deployment: 1 |
Suggestion: add an annotation to explain why this reference designator only has 1 deployment. By Lori Garzio, on 1/31/19 |


