CTD
- Reference Designator
- GI02HYPM-RIM01-02-CTDMOG039
- Start Depth
- 164
- End Depth
- 164
- Location
- Fixed on Inductive Wire
- Current Status
- Review Complete
- M2M Example
- https://ooinet.oceanobservatories.org/api/m2m/12576/sensor/inv/GI02HYPM/RIM01/02-CTDMOG039/metadata
| Method | Data Stream | Content | Type | |
|---|---|---|---|---|
| recovered_host | ctdmo_ghqr_offset_recovered | Offset Data | Report M2M | Engineering |
| recovered_host | ctdmo_ghqr_sio_mule_instrument | Data Products | Report M2M Stats | Science |
| recovered_inst | ctdmo_ghqr_instrument_recovered | Data Products | Report M2M Stats | Science |
| telemetered | ctdmo_ghqr_sio_mule_instrument | Data Products | Report M2M Stats | Science |
| telemetered | ctdmo_ghqr_sio_offset | Offset Data | Report M2M | Engineering |
| Deployment | Cruise | Start Date | Stop Date | Mooring Asset | Node Asset | Sensor Asset | Latitude | Longitude | Deployment Depth | Water Depth |
|---|---|---|---|---|---|---|---|---|---|---|
| 1 Review | KN221-04 | 09/11/2014 | 08/16/2015 | CGMGI-02HYPM-00001 | CGINS-CTDMOG-12190 | 59.9753 | -39.4818 | 162 | 2678 | |
| 2 Review | AT30-01 | 08/16/2015 | 07/16/2016 | CGMGI-02HYPM-00002 | CGINS-CTDMOG-13439 | 59.9727 | -39.5248 | 162 | 2667 | |
| 3 Review | AR7-01 | 07/11/2016 | 08/10/2017 | CGMGI-02HYPM-00003 | CGINS-CTDMOG-11646 | 59.9695 | -39.4886 | 138 | 2673 | |
| 4 Review | AR21 | 08/06/2017 | 06/16/2018 | CGMGI-02HYPM-00004 | CGINS-CTDMOG-10219 | 59.9733 | -39.9256 | 160 | 2659 | |
| 5 Review | AR30-03 | 06/09/2018 | 08/10/2019 | CGMGI-02HYPM-00005 | CGINS-CTDMOG-13621 | 59.9697 | -39.49 | 160 | 2669 | |
| 6 Review | AR35-05 | 08/06/2019 | CGMGI-02HYPM-00006 | CGINS-CTDMOG-11611 | 59.9729 | -39.5308 | 160 | 2664 |
| Metadata | Start Date | End Date | Comment |
|---|---|---|---|
|
GI02HYPM |
I submitted a helpdesk question on 11/12/2018 regarding an offset between recovered and telemetered data for all global HYPMs: "There appears to be a substantial offset between data with the same timestamps from recovered_wfp and telemetered methods for all deployments of all global WFP CTDs, and I have included information from two representative deployments of two different profilers as examples. It looks like the values recorded for the first common timestamp are exactly the same, and as the profiler moves along in time the offset between the values recorded for the same timestamp become increasingly more offset. Then, the profiler reaches the end of the profile (either at its shallowest or deepest point), resets, and the pattern begins again. This is most easily seen in the pressure data, but there is an offset for all science parameters. Examples: The *_intersect.csv files attached contain data where recovered and telemetered timestamps intersect. For each timestamp and science parameter there are recorded values (from .nc files downloaded from the system) and the difference. For each parameter, the difference between the values at the bottom and top of the profiler's range are exactly zero, and (particularly for pressure) the differences steadily increase until they are reset at zero at the bottom/top of the profile. This pattern continues throughout the deployment. The plots attached are zoomed in to one upcast and one downcast, and highlight the offset in the data between the two methods." Redmine 13743 By Lori Garzio, on 8/5/19 |
||
|
GI02HYPM-RIM01-02-CTDMOG039 |
8/16/15, 10:59 PM | 6/16/18, 6:32 AM |
Deployments 2, 3, 4: deployment depths from asset management are substantially different than the pressure recorded by the instrument. If the deployment depths in asset management are correct, the data should be annotated to indicate why the pressure values are so different from the depth at which the instrument was deployed. By Lori Garzio, on 1/2/19 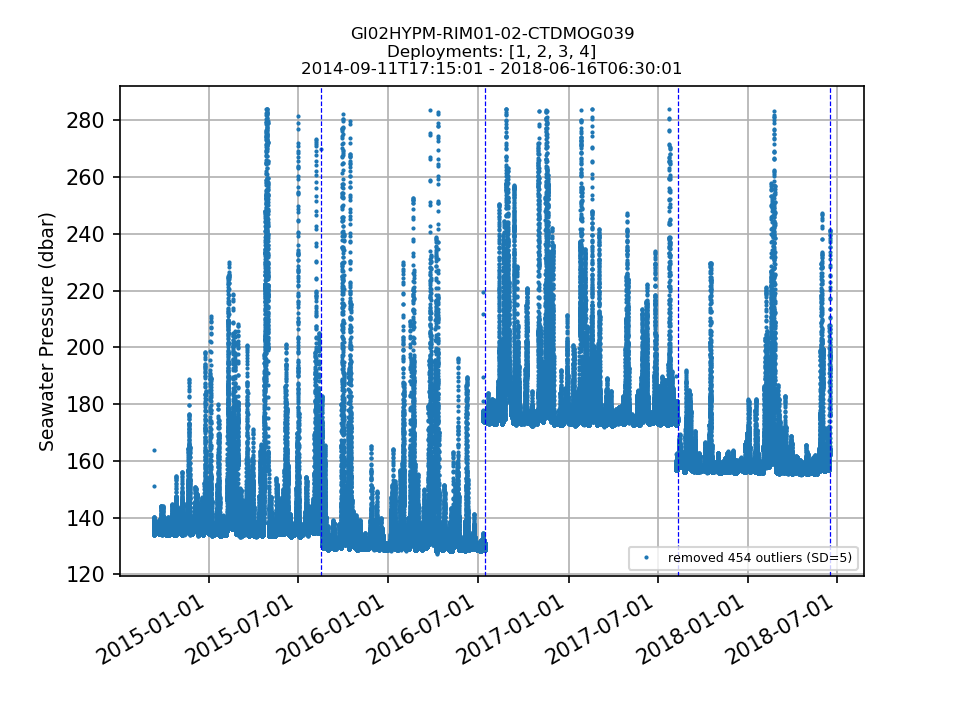 |
No annotations yet.