3-Wavelength Fluorometer
- Reference Designator
- CE05MOAS-GL311-02-FLORTM000
- Start Depth
- 0
- End Depth
- 1,000
- Location
- Current Status
- Review Complete
- M2M Example
- https://ooinet.oceanobservatories.org/api/m2m/12576/sensor/inv/CE05MOAS/GL311/02-FLORTM000/metadata
| Method | Data Stream | Content | Type | |
|---|---|---|---|---|
| recovered_host | flort_m_sample | Data Products | Report M2M Stats | Science |
| telemetered | flort_m_sample | Data Products | Report M2M Stats | Science |
| Metadata | Start Date | End Date | Comment |
|---|---|---|---|
|
CE05MOAS |
Bad altimeter pings are apparent in many deployments of the coastal gliders. A few example plots are attached - m_water_depth plotted as semi-transparent bathymetry. By Lori Garzio, on 5/10/19 |
||
|
CE05MOAS-GL311 |
Data look suspect for several different time points and deployments for this glider. For example, zoomed in plots from 11/12/2014 - 11/14/2014 show what looks to be a time lag in the dissolved oxygen data? The glider not going to the surface shows up in the overall deployment 1 graph as a band around 50 dbar. The deployment 4 overall graph has a similar banding feature around 5 dbar. Zoomed in plots from 10/1/2017 - 10/3/2017 depicts very high DO concentrations at the surface on the first downcast. The corresponding temperature data from the CTD has a lower temperature value at the very beginning of each downcast (easily seen in the profile and xsection plots attached). Similar features are seen in other deployments of other gliders, but these were the most pronounced examples I have seen so far. Some possible issues could be a time lag, biofouling, sensor failure, etc. By Lori Garzio, on 5/13/19 |
||
|
CE05MOAS |
Glider optodes typically exhibit a sensor lag of 20-25 seconds. Example attached of 3 consecutive down and up casts for CE05MOAS-GL312-04-DOSTAM000 on 7/8/2014 showing a typical measurement time lag. Profiles should be analyzed for individual time lags and data should be adjusted. OOI doesn't necessarily need to make the adjustment but users should be aware of the issue. By Lori Garzio, on 5/14/19  |
||
|
CE05MOAS-GL311-02-FLORTM000 Deployment: 1 |
Suspect data after 11/10/2014 By Lori Garzio, on 5/13/19 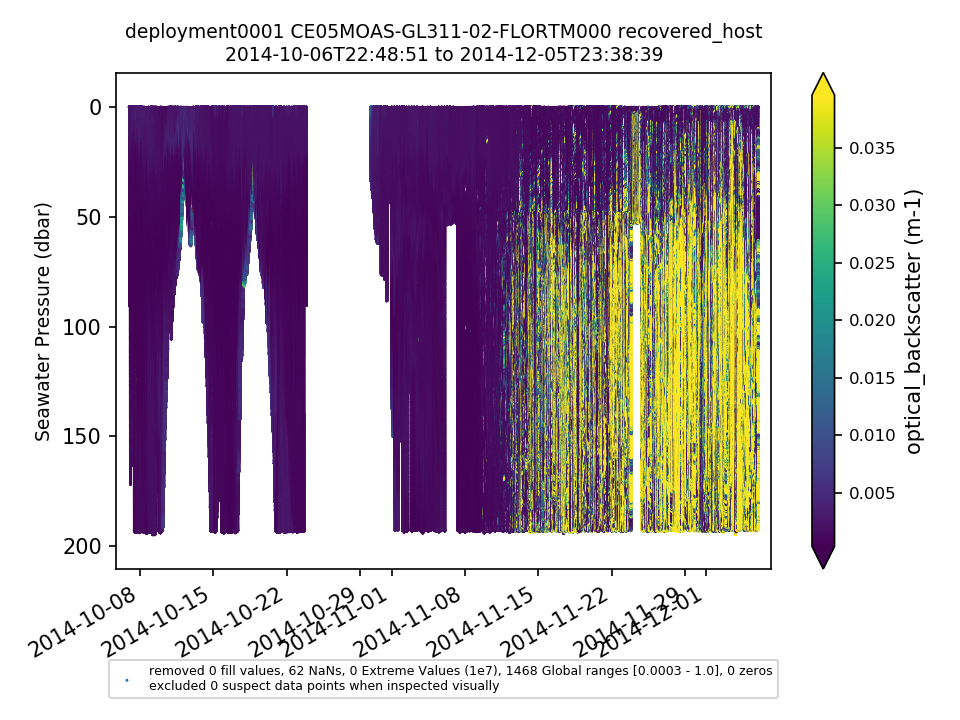 |
||
|
CE05MOAS-GL311 Deployment: 2 |
It looks like the glider deviated from the mission. Dataset should be annotated. By Lori Garzio, on 5/10/19 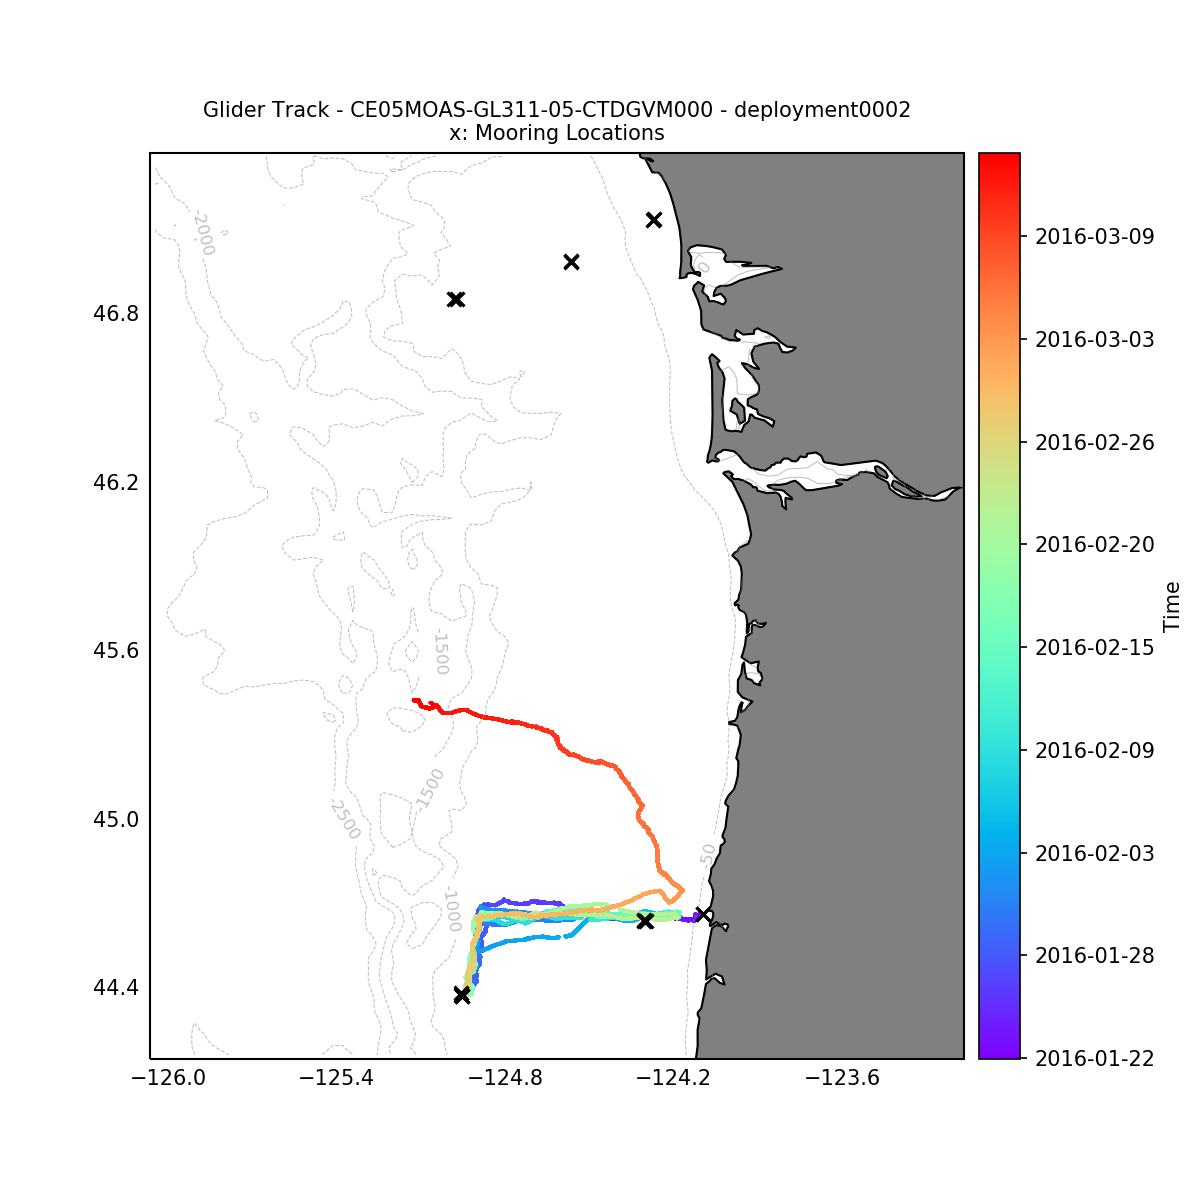 |
||
|
CE05MOAS-GL311 Deployment: 5 |
Short deployment (4 days) should be annotated. By Lori Garzio, on 5/9/19 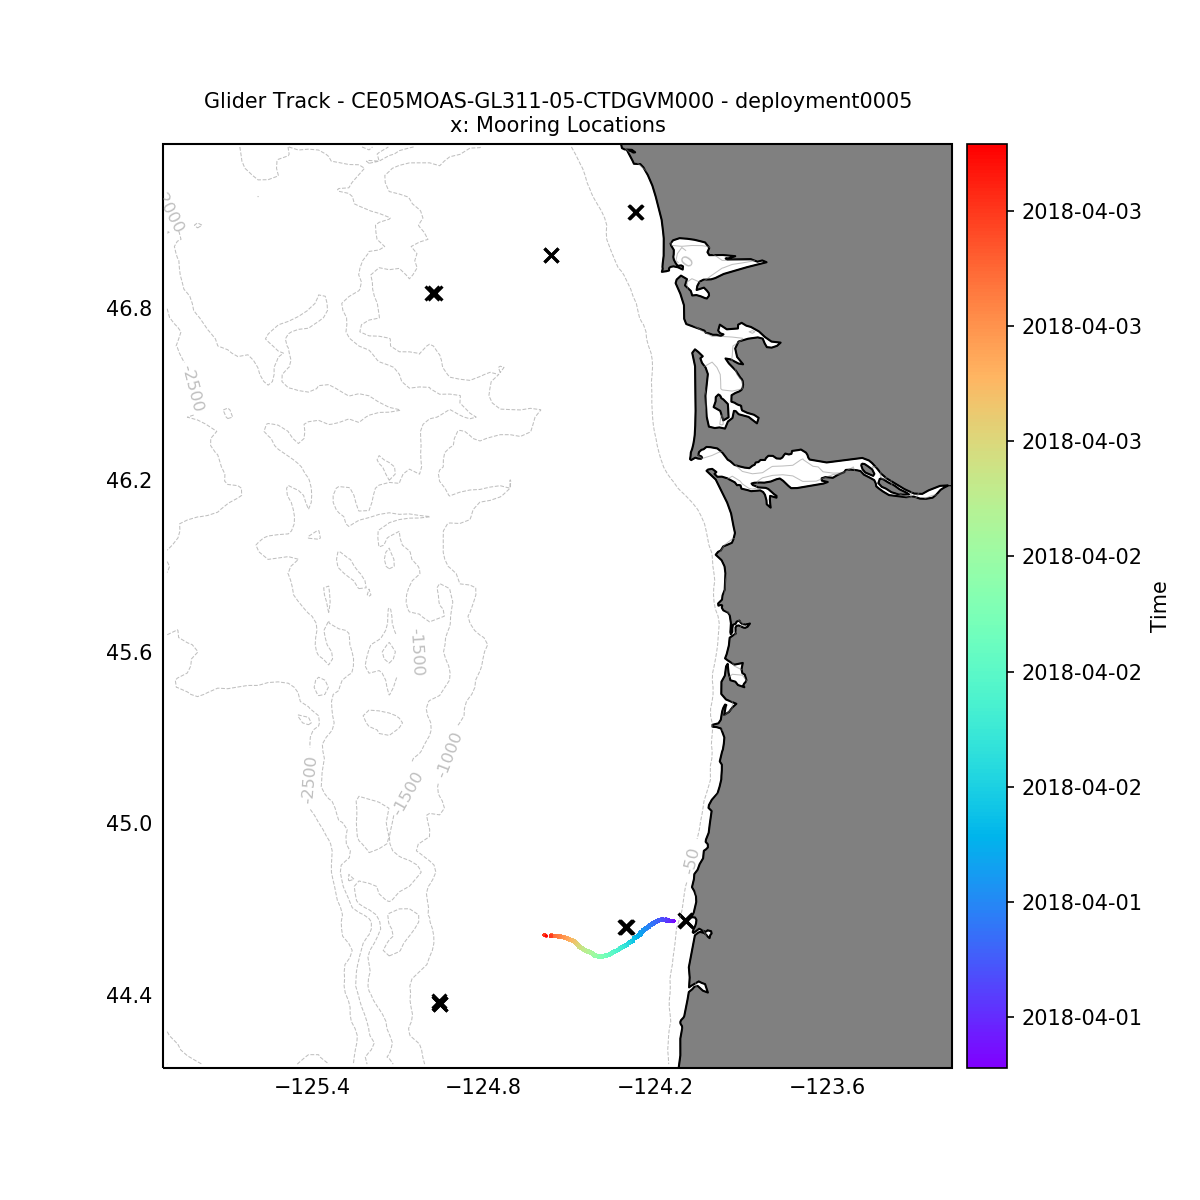 |
||
|
CE05MOAS-GL311 Deployment: 6 |
Sampling pattern changed on 5/14/2018. This should be annotated. By Lori Garzio, on 5/13/19  |
No annotations yet.